
When we talk about election results, we often divide communities into two categories: red and blue. These labels make it easy to summarize an election, but they also leave out a great deal of information about the people who make up our neighborhoods.
As Dream City PAC continues examining Arlington's November 2026 election results, we wanted to look beyond which party received more votes and explore the range of voting patterns across our city.
What happens when we stop looking at Arlington as a collection of red and blue neighborhoods and instead examine our community along a continuum?
Every Dot Represents a Precinct
Our precinct continuum graphics examine the two-party voting margins from the 2026 general election.
Each dot represents one voting precinct in Arlington with at least 30 ballots cast. The dots are positioned according to the combined two-party voting margin across the races included in the analysis.
Rather than assigning each precinct a simple partisan identity, the continuum allows us to see the differences between precincts that voted overwhelmingly for one party and those where the vote was more evenly divided.
For the purpose of these graphics, precincts are grouped into three categories:
Blue: Democratic share of the two-party vote was at least 55%.
Purple: Voters were in the middle, and their share was between 45% and 55%.
Red: Republican share of the two-party vote was at least 55%.
These categories help describe the distribution, but the position of each dot provides more detail than its color alone.
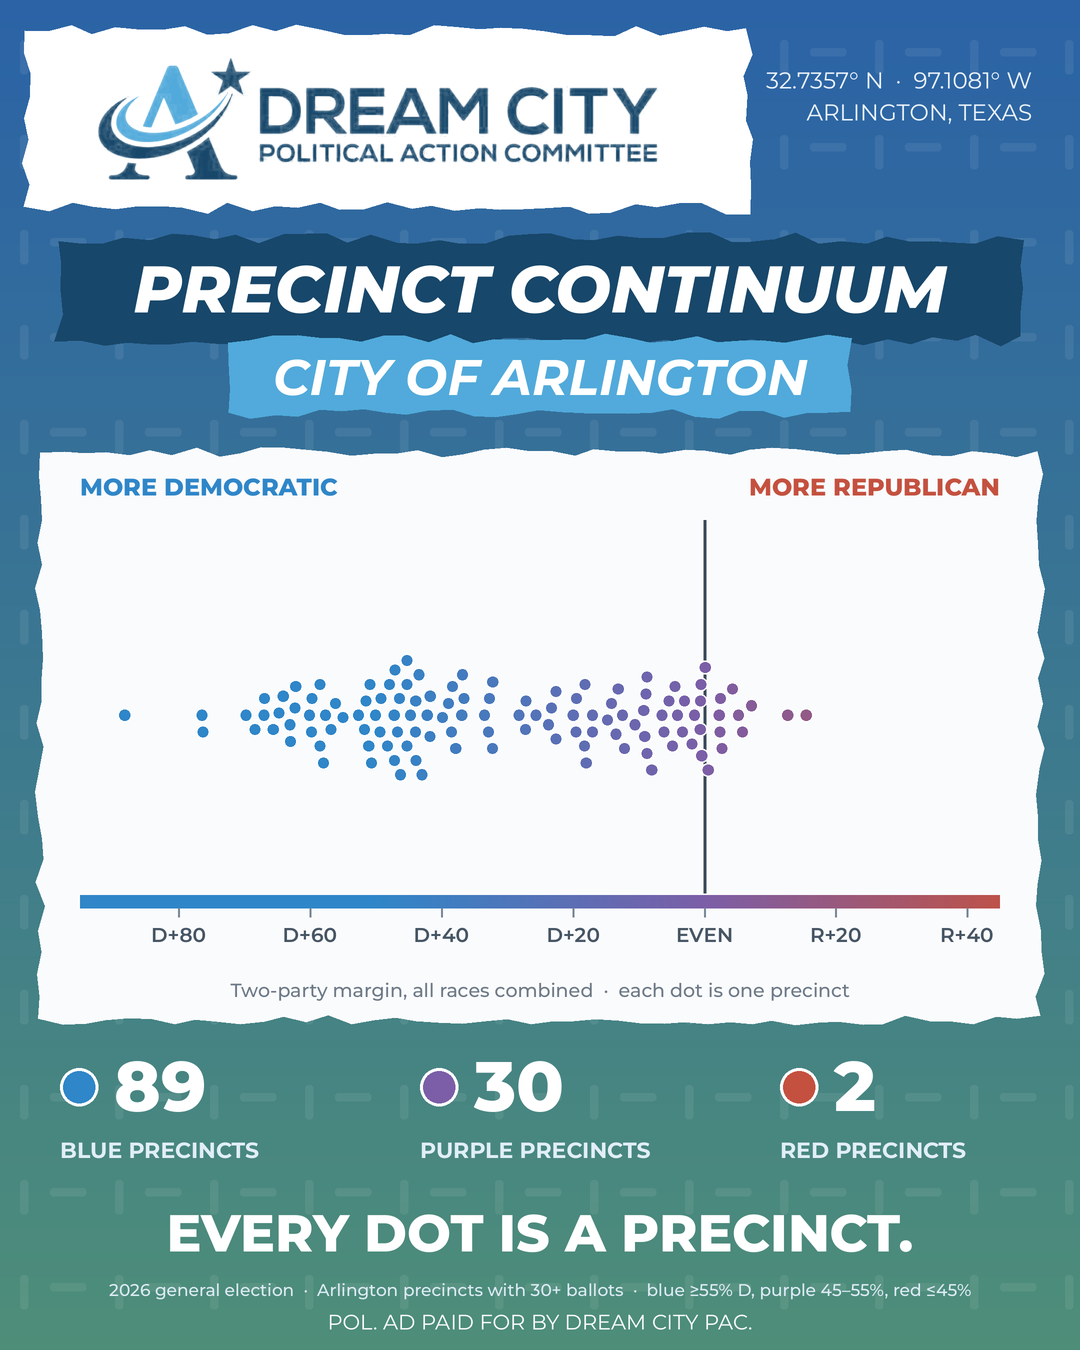
City of Arlington by Precinct
The Five Districts Tell Different Stories
Looking at the continuum within each Arlington City Council district adds another layer to our understanding.
District 1: A Consistent Democratic Lean
District 1's graphic includes 22 blue precincts and four purple precincts. Although most precincts fall on the Democratic side of the continuum, their margins vary considerably. Some are much closer to the middle, while others show substantially larger Democratic margins.
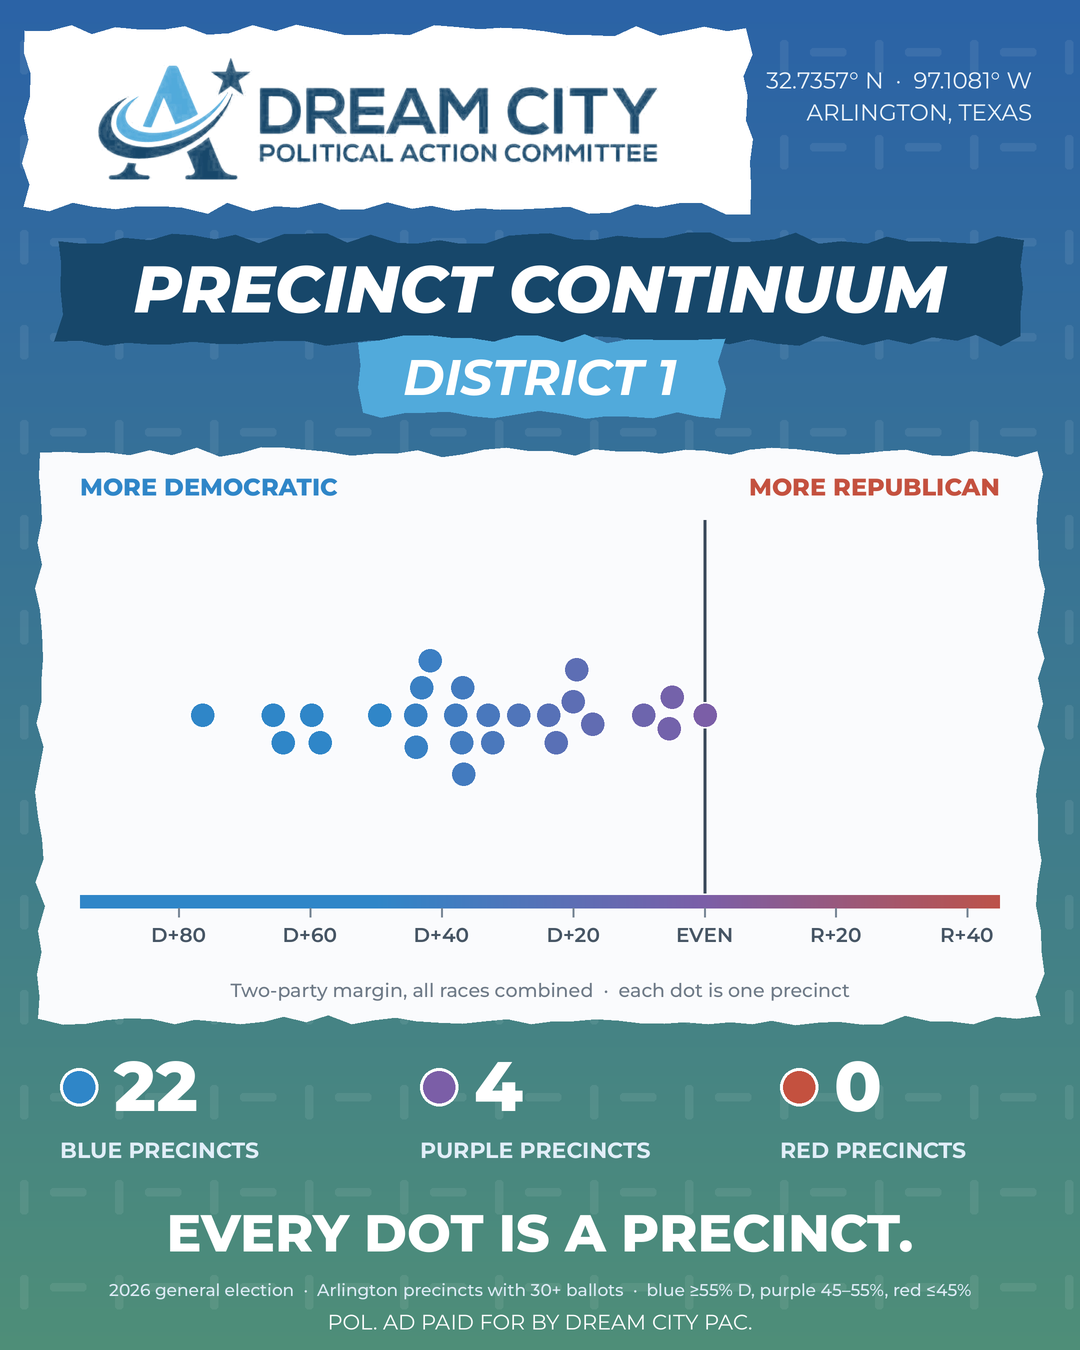
District 1 Precincts
District 2: A Wider Distribution of Voting Patterns
District 2 includes 13 blue precincts and 11 purple precincts. Its distribution is especially interesting because the precincts form two noticeable concentrations: one with stronger Democratic margins and another closer to an even division. This illustrates how a single council district can contain neighborhoods with substantially different voting patterns.
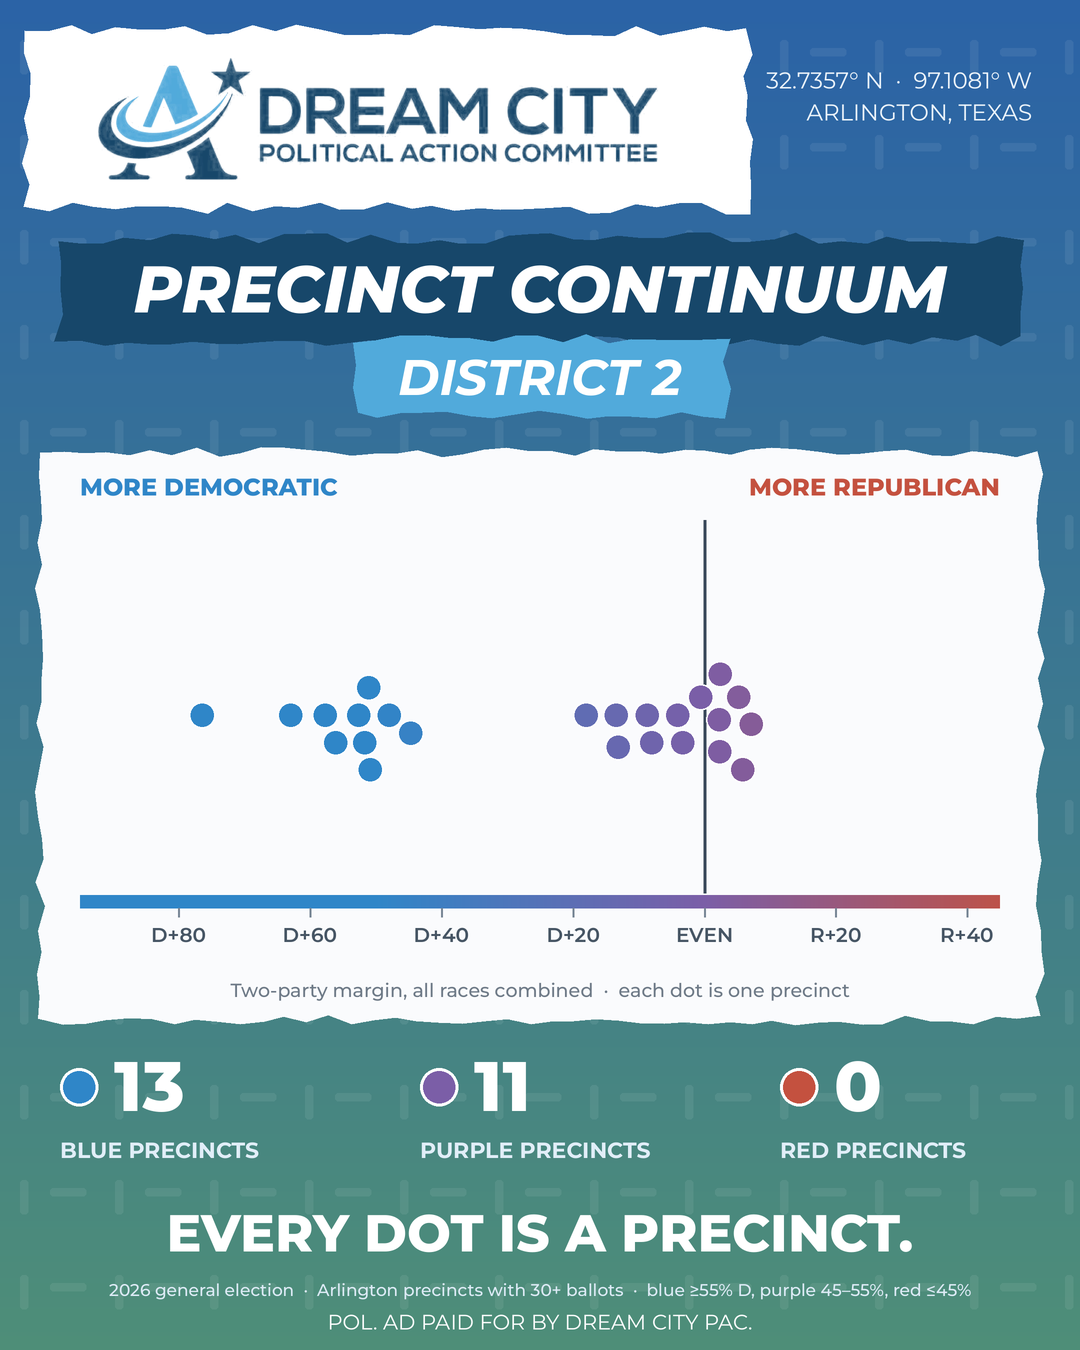
District 2 Precincts
District 3: The Strongest Concentration of Democratic-Leaning Precincts
All 25 precincts represented in District 3's graphic fall into the blue category. The precincts also tend to cluster farther toward the Democratic end of the continuum than those in several other districts.
Even here, however, the margins are not identical. There is variation among precincts that share the same broad classification.
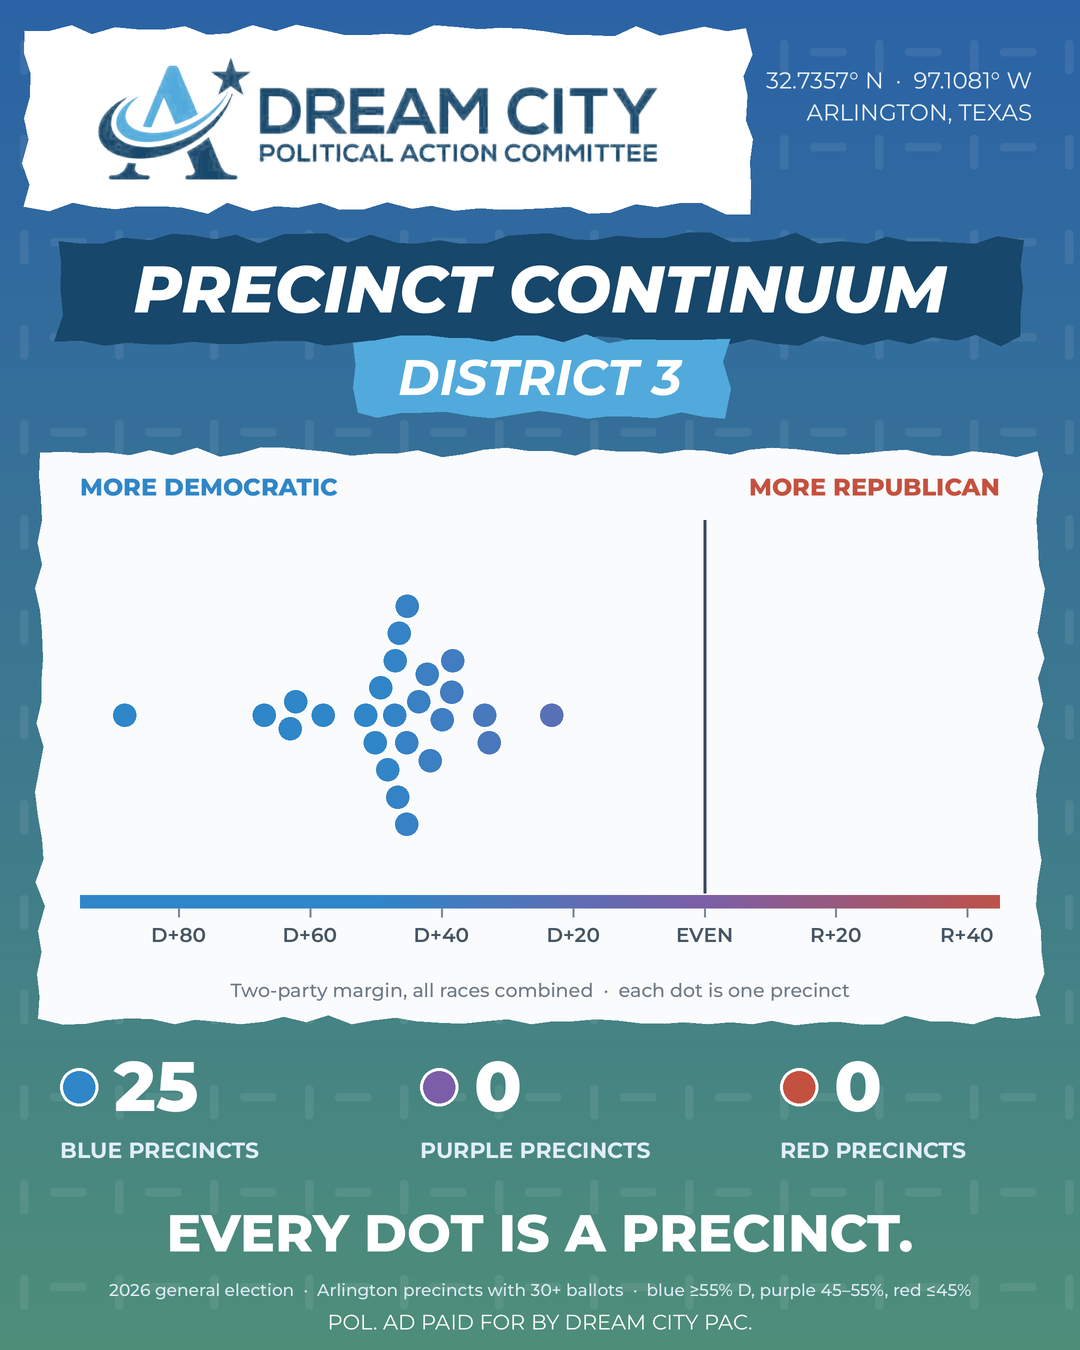
District 3 Precincts
District 4: The Broadest Mix of Classifications
District 4 includes 11 blue precincts, 13 purple precincts, and two red precincts. It is the only district in these graphics with precincts in all three classifications.
Its distribution illustrates why looking at the continuum is useful. Within one council district, precinct voting patterns range from substantial Democratic margins to Republican-leaning results.
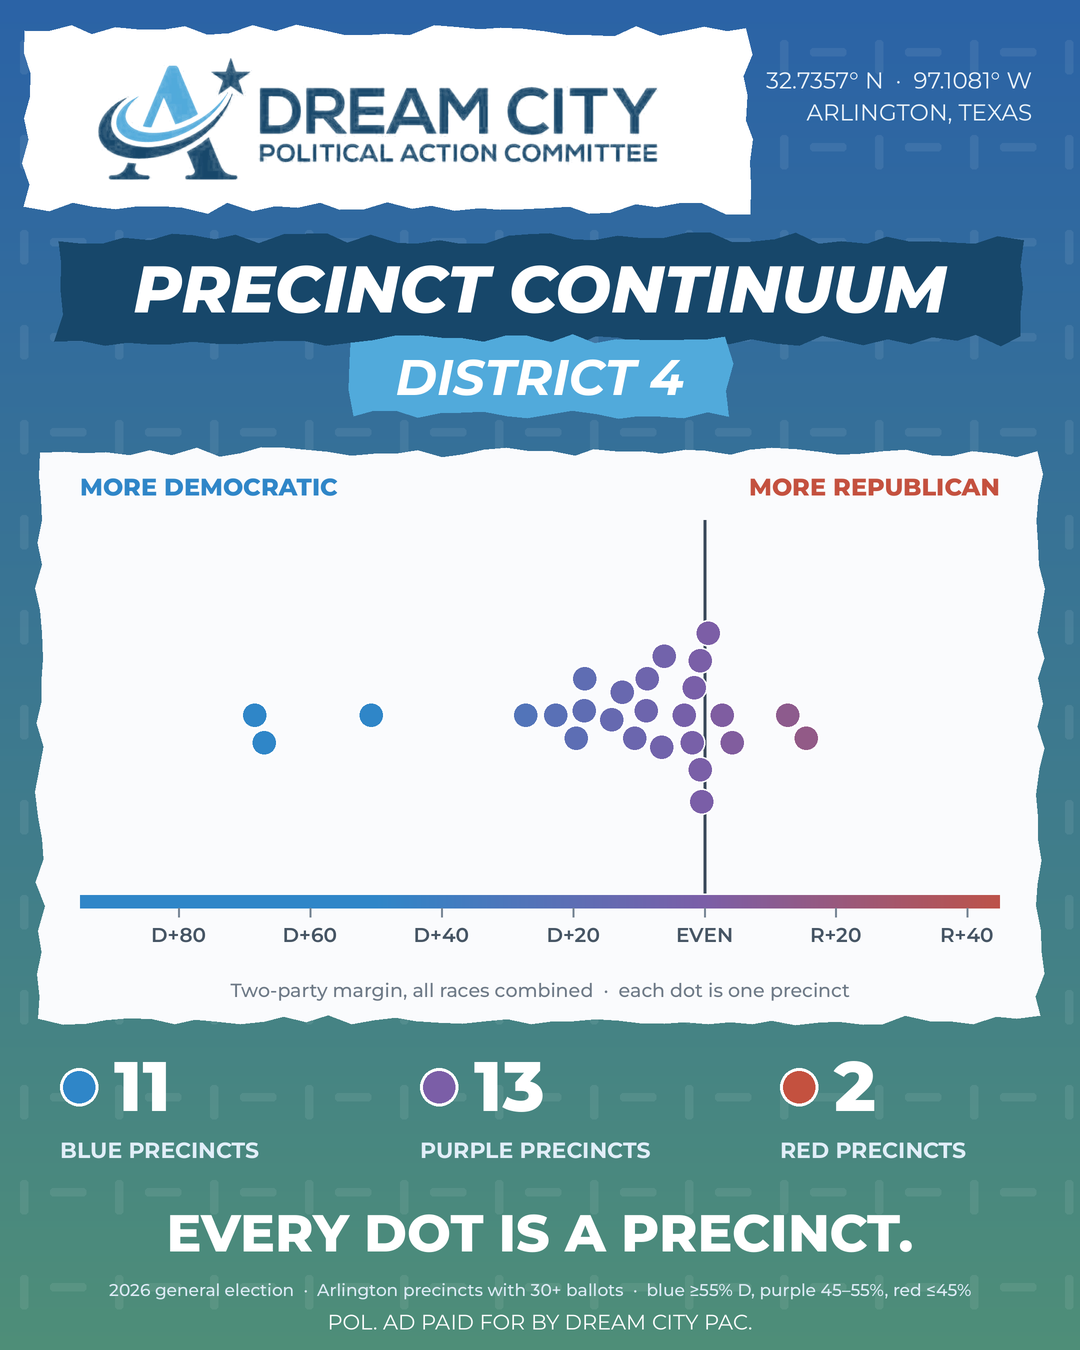
District 4 Precincts
District 5: Democratic-Leaning With Variation in Margins
District 5 includes 17 blue precincts and two purple precincts. Most precincts fall clearly on the Democratic side, but there is still a considerable range in voting margins among them. Similar to District 1, the overall classification is only part of the story.
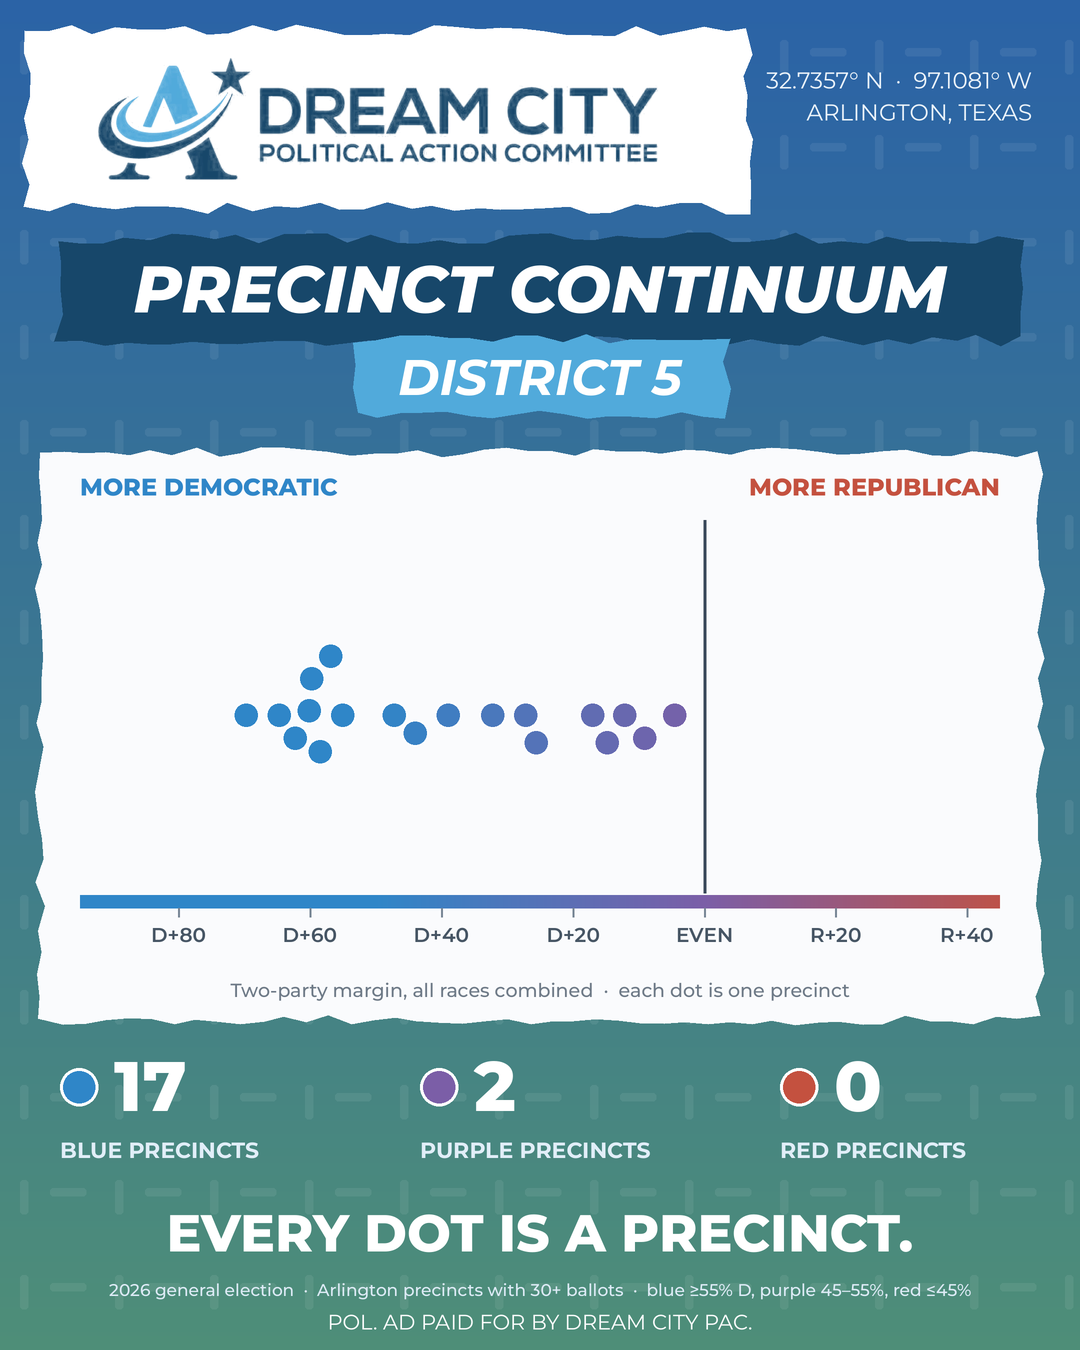
District 5 Precincts
Voting Patterns Are Not the Same as Individual Beliefs
One important limitation of election data is that it tells us how people voted, not everything they believe. A precinct's voting margin cannot tell us how residents feel about every issue facing Arlington. It cannot explain their priorities for public education, infrastructure, housing, public safety, or local government. Nor does it tell us why individual voters selected particular candidates.
People can share a vote in one election while holding very different perspectives on other issues. That distinction is important when interpreting these graphics. The continuum describes aggregate election results. It is not a measure of every resident's political identity, and it does not account for residents who did not vote.
Why Understanding the Continuum Matters
At Dream City PAC, our mission centers on engaging Arlington residents, building people-powered civic participation, and supporting leadership that reflects the values, needs, and voices of our community. That work requires us to understand the community we serve.
Election data provides one way to do that, but it is most useful when paired with community conversations, listening, and ongoing engagement.
The continuum encourages us to recognize variation rather than assume everyone in a neighborhood shares the same political identity. It also challenges us to think more carefully about how we engage residents across Arlington.
The issues that matter to our community do not always fit neatly into partisan categories. Public education, neighborhood development, transportation, and access to local services affect residents across the political spectrum.
Understanding the range of perspectives within our city can help us approach those conversations with greater curiosity and a clearer picture of the people involved.
Data and Methodology
These graphics use the combined two-party voting margins from races included in the November 2026 general election analysis. Each dot represents one precinct with at least 30 ballots cast.
Precincts are classified according to the Democratic share of the two-party vote: blue at 55% or higher, purple between 45% and 55%, and red at 45% or lower.
The graphics describe precinct-level election results, not individual political beliefs, registered-voter turnout rates, or residents who did not participate.
The citywide graphic contains 121 precincts, while the five district graphics collectively display 120. This discrepancy should be reconciled before using the district figures as an exhaustive breakdown of the citywide total.
