
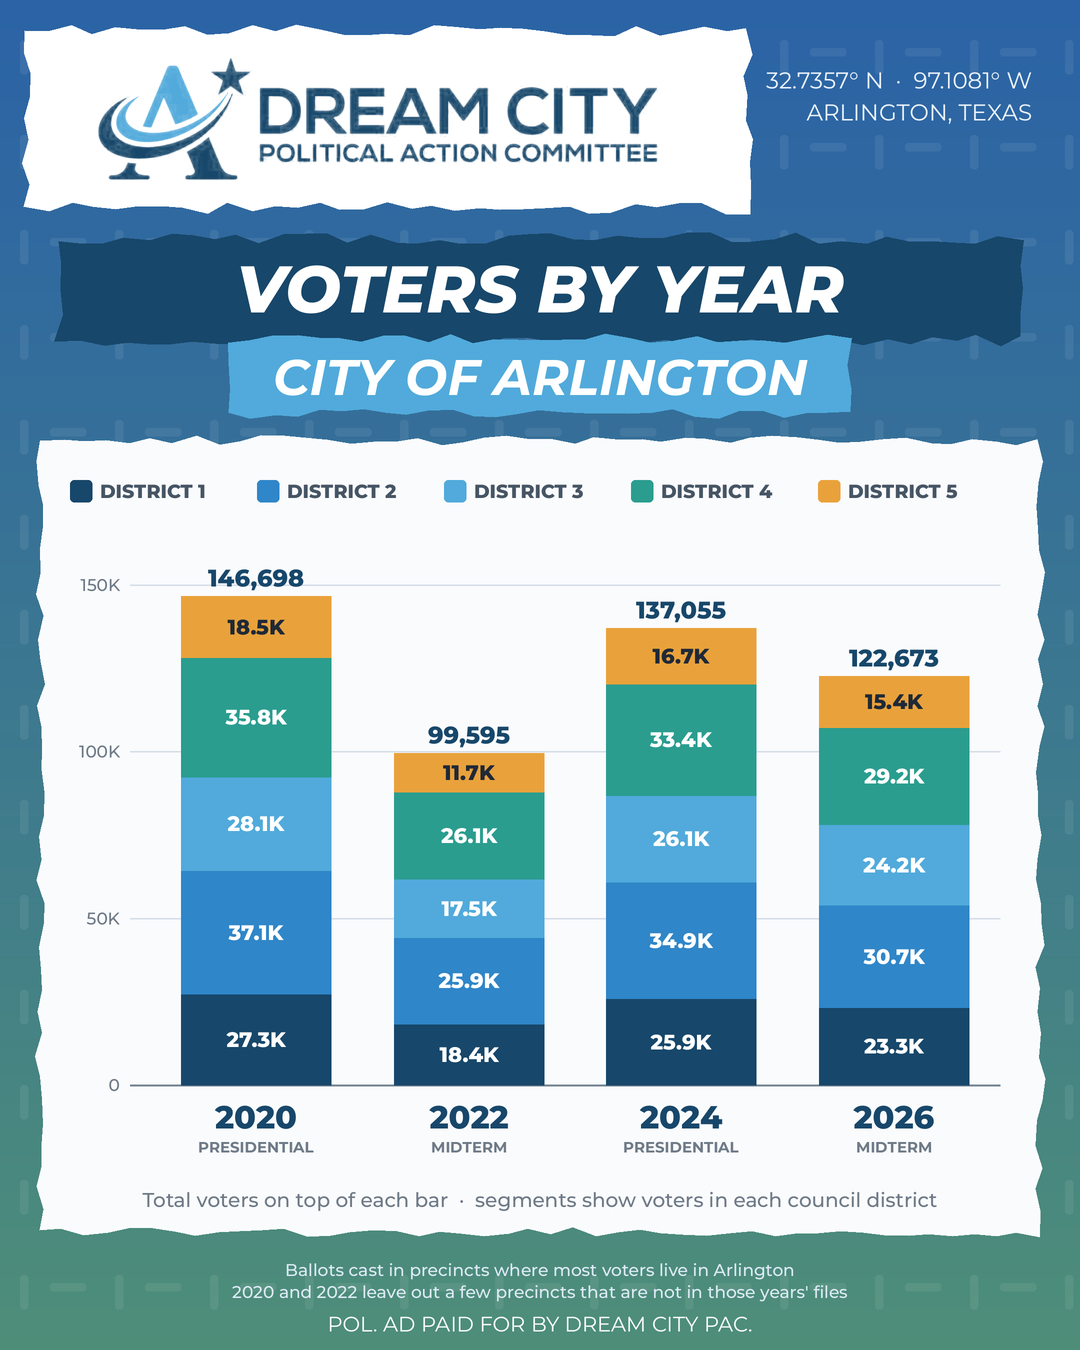
Arlington has something worth celebrating. In the November 2026 midterm election, 122,673 ballots were cast across the Arlington precincts included in our analysis. That represents an increase of 23,078 ballots, or approximately 23%, compared with the 2022 midterm election.
Beyond the citywide total, the district-level numbers tell an equally important story: every Arlington City Council district saw an increase in ballots cast compared with 2022.
At Dream City PAC, we believe understanding how our community participates in elections is an important part of building a more engaged Arlington. These numbers offer an opportunity to recognize that participation while also examining where and how it is changing.
Midterm Participation Increased Across Arlington
Presidential elections traditionally attract more voters than midterm elections, and Arlington's recent election history reflects that pattern.
In the 2020 presidential election, the precincts included in our analysis recorded 146,698 ballots. That number declined to 99,595 in the 2022 midterm election before increasing to 137,055 in the 2024 presidential election. The 2026 midterm election brought 122,673 ballots, substantially more than the previous midterm and only about 14,400 fewer than the 2024 presidential election.
City of Arlington Ballots Cast by District
Every District Contributed to the Increase
Looking at Arlington's five City Council districts reveals that the growth in participation was not limited to one area of the city.
District 3 experienced the largest percentage increase, with approximately 38% more ballots than in 2022. District 5 followed with an increase of approximately 32%, and District 1 recorded an increase of approximately 27%.
District 2, which contributed the largest number of ballots in 2026, experienced an increase of approximately 19%. District 4 also recorded an increase of approximately 12%.
These differences are worth exploring further. They raise questions about how participation is changing across Arlington, including the role of voter registration, population changes, voter outreach, and access to polling locations. The available figures do not tell us which factors contributed most to these increases, but they provide a useful starting point for future analysis.
Arlington's Geographic Voting Patterns Remained Consistent
One of the more interesting findings is how consistently the five districts contributed to Arlington's overall ballot totals. Across the four elections examined, District 2 accounted for roughly one-quarter of the city's ballots. District 4 consistently contributed approximately one-quarter, as well.
Districts 1 and 3 each accounted for approximately one-fifth of the total, while District 5 contributed approximately one-eighth. Despite changes in overall participation, these proportions remained relatively stable. The distribution of ballots among Arlington's five districts did not change dramatically, even as the overall number of ballots increased.
Understanding these patterns can help inform future conversations about civic participation, the different experiences of residents across our city, and which district hold voting power in the city.
Celebrating Participation, Continuing to Learn
Elections often become conversations about candidates, parties, and outcomes. Those conversations matter, but they are not the only way to understand an election. Participation itself tells us something important about our community.
Across Arlington, tens of thousands of residents took the time to cast a ballot. Community organizations shared voting information, volunteers helped neighbors navigate the process, and residents made decisions about the future of their communities.
At Dream City PAC, our work is grounded in engaging residents, encouraging civic participation, and ensuring that the people of Arlington have opportunities to shape the decisions affecting their lives. The 2026 election gives us an opportunity to celebrate that participation and continue learning about the community we serve.
Data and Methodology
This analysis uses ballot counts presented in Dream City PAC's Voters by Year graphics for the 2020, 2022, 2024, and 2026 general elections.
The figures represent ballots cast in precincts where most voters live in Arlington, grouped by City Council district. A small number of precincts are absent from the 2020 and 2022 datasets. District figures displayed in the graphics are rounded, so district-level percentage changes are approximate.
The analysis compares the number of ballots cast, not turnout rates among registered or eligible voters.
